Wayline - the top-ranked answer was correct and useless
The first ranking the engine produced put completed_onboarding_step_1 at the
top, at 9.64× retention lift.
That is a spectacular number and it is worth nothing. The predicate is satisfied by 16,278 of 25,000 users. It means, roughly, "did anything at all after signing up," and no product manager can run an experiment to nudge people toward doing something.
The engine wasn't broken. It had measured a real effect correctly, and the effect was arithmetic: about a fifth of users never return after signup and retain at 0%, so any predicate that excludes them inflates its own lift - and the broadest predicates exclude them most cleanly. The engine was ranking behaviors by how well they separate the engaged from the absent, when the question worth answering is which behaviors separate users among the already-engaged.
That gap, between a statistically correct answer and a usable one, is what most of this project turned out to be about.
- What it is. An engine that reads raw product event streams and finds the behaviors that predict whether a user is still there in week four - the "30 messages in 7 days" number, discovered rather than guessed.
- What it does. Mines 44 candidate milestone shapes, scores each by retention lift, filters for actionability, runs ordered-sequence path analysis, then has Claude Sonnet 4.6 draft an experiment spec per finding: hypothesis, target segment, success event, guardrails, expected effect.
- How it's checked. The generator gives every synthetic user a hidden persona. The engine is never allowed to read that column. Every claim it makes is validated afterward by joining back to ground truth it couldn't see.
- The two results that surprised me. The best-scoring milestone was useless, and fixing that took a filter I hadn't planned for. Then my own validator for the LLM output turned out to have a 100% false-positive rate.
- Get it.
docker compose up -d && uv run python data/generate.py && uv run python api/engine/run.py- about nine seconds end to end. github.com/egehazar/wayline.
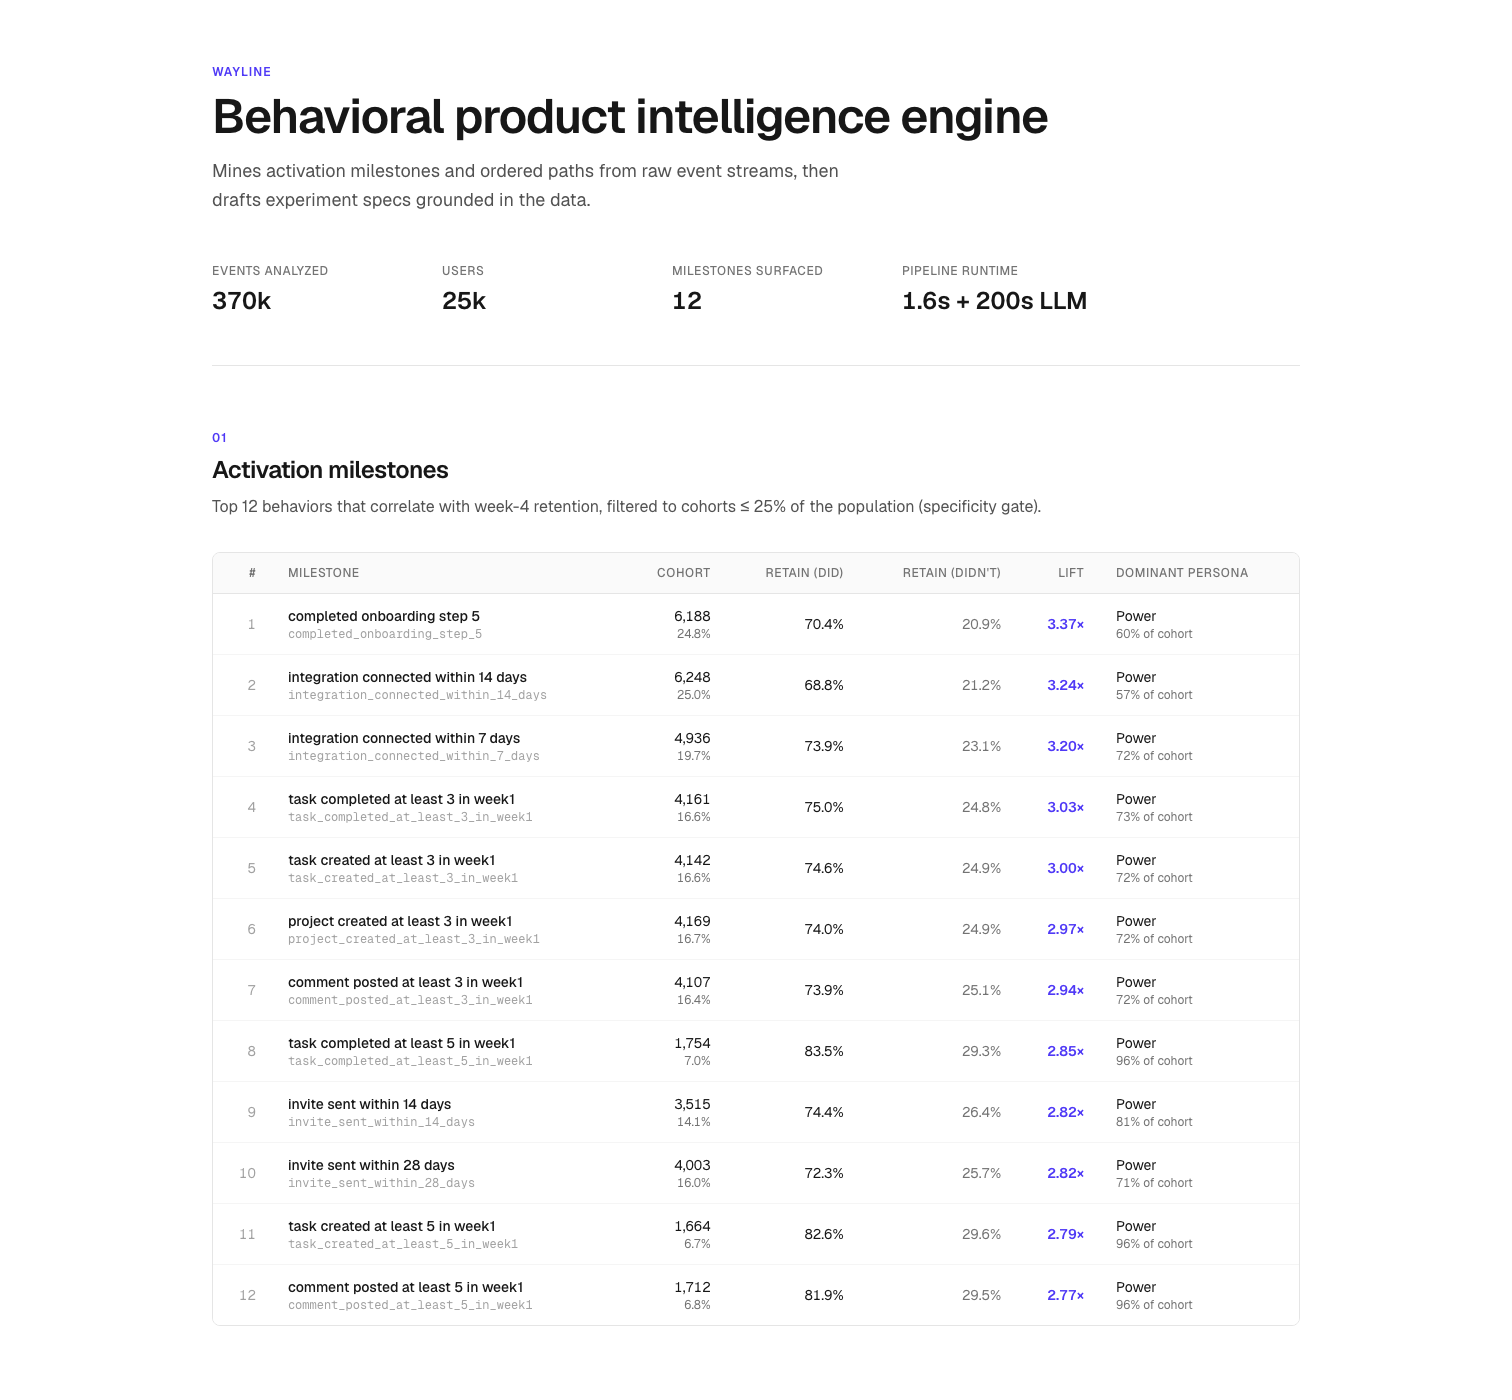
The dashboard against a freshly generated dataset. One Server Component, three endpoints fetched in parallel during SSR. The persona column on the right is the ground truth the engine was never allowed to read.
The specificity filter
The fix is a single parameter: a milestone counts as actionable only if at most 25% of users hit it.
Of 44 candidate shapes, 39 clear the minimum-sample threshold of 200 users. The specificity cap cuts 15 of those 39 - every broad early-funnel predicate - leaving 24. What surfaces underneath is what I had been looking for:
| # | milestone | cohort | retained | lift | Power share |
|---|---|---|---|---|---|
| 1 | completed_onboarding_step_5 | 6,188 | 70.4% | 3.37× | 60.3% |
| 2 | integration_connected_within_14_days | 6,248 | 68.8% | 3.24× | 57.0% |
| 3 | integration_connected_within_7_days | 4,936 | 73.9% | 3.20× | 72.2% |
| 4 | task_completed_at_least_3_in_week1 | 4,161 | 75.0% | 3.03× | 72.8% |
| 5 | task_created_at_least_3_in_week1 | 4,142 | 74.6% | 3.00× | 71.8% |
A 3.37× lift is a far less impressive headline than 9.64×, and it's the one worth having. "Users who finish onboarding step 5 retain at 3.4× the rate of users who don't" is a sentence a team can act on. "Users who did something retain better than users who did nothing" is not a finding - it's a tautology with a decimal point.
Both tables stayed in the CLI output, raw and filtered. The raw one is how you confirm the mechanics are sound; the filtered one is the answer. Deleting the raw table would have hidden the most instructive thing the engine ever produced.
One entry deserves singling out. task_completed_at_least_5_in_week1 ranks eighth
by lift with the smallest cohort in the table (1,754 users) - and the highest
absolute retention anywhere in the output, 83.5%. Aggregate lift undersells it
because the cohort is too small to move the population denominator. In product
terms it is the sharpest single signal the engine found. Ranking by one statistic
will always do this to you, which is a decent argument for making the engine show
its work instead of emitting a winner.
Validating against ground truth the engine can't see
An engine that mines correlations will always return something. Whether what it returns is real can't be answered with the same data the engine used to decide.
So the generator assigns each user one of four hidden personas - Power (15%),
Activator (30%), Looker (35%), Bouncer (20%) - each with its own event
probabilities, timing distributions, and retention rate. The engine never touches
the persona column. It sees events and a retention label derived from activity
in days 21–28 after signup. Nothing else.
Validation happens afterward, by joining results back to the column the engine was forbidden to read. Every top-5 actionable milestone comes back 57–73% Power, Activator second, Lookers at or below 1.4%, and Bouncers at exactly 0.0% across the board. That's the result I wanted: the engine isolated behaviors that discriminate among engaged users, not behaviors that merely separate the engaged from the absent. Before the specificity filter, the top milestones were majority-Activator with heavy Looker presence - the signature of a predicate that's just measuring "showed up."
This is the part I'd point at first if someone asked whether the project is serious. The mining is a hundred lines of Polars. Having a ground truth the miner is structurally forbidden from seeing, and reporting what it says even when it's unflattering, is the difference between an analysis and a demo.
Synthetic data has to have structure worth finding
Naive synthetic data would have killed this project silently. Generate events uniformly at random and every behavior correlates with retention at exactly the base rate - the engine finds nothing, and you can't tell whether that's because the engine is broken or because there was nothing there.
Real product data has latent structure: some users are genuinely invested and reveal it through specific behaviors, others are tire-kickers, and the mapping from behavior to retention is statistical rather than deterministic. The generator's job is to encode that structure so the engine's job - discovering the signature of user types it doesn't know exist - is a real task with a checkable answer.
Two corrections along the way, both mine:
The rates were wrong by 4–5×. The persona spec called for Poisson(λ=3)
sessions per day for Power users in week one, tapering by persona. Across 25,000
users and a 60-day window that projects to roughly a million events, well past the
250–400k target. I recalibrated the session rates rather than widening the target,
preserving the two things the engine actually learns from: the persona ranking,
and the per-event-type probabilities (integration_connected at P=0.95 for Power,
P=0.35 for Activator). Absolute session volume doesn't change a behavioral
signature; the relative structure does.
Retention was leaking. The first run had Lookers retaining at 33% against a 15% target. The cause was structural rather than a typo: the Looker spec includes a one-to-four-week onboarding window, and non-retained Lookers' onboarding events were spilling into the days 21–28 window the retention label reads from. Users who were supposed to be gone looked present, because their slow onboarding was still trickling. I made retention an explicit Bernoulli draw at user-generation time and clipped non-retained users' events to before day 21. Real retention has exactly this kind of spillover; for a test bed where the measured label needs to reflect the persona's intent cleanly, the clip is right - and it's a deviation from realism that belongs in the notes rather than being quietly enjoyed.
After both fixes: 370,489 events for 25,000 users in 7.3 seconds - 1.6s
generating in memory, 5.7s streaming into Postgres through psycopg's copy().
Row-by-row inserts would be minutes per run, and at the rate I was re-tuning
persona parameters that difference decided how many iterations I could afford. A
13-check verifier gates every regeneration: persona mix within 0.5pp of spec,
per-persona retention within 1pp, zero orphan events. Same seed, same dataset -
the only reason any of the evaluation above means anything.
Order matters, so measure it separately
Milestone mining answers "which behaviors correlate with retention." It has nothing to say about sequence, and sequence is often the actual product question: a user who creates a workspace, finishes onboarding, then connects an integration may be a different animal from one who connects an integration on day one before touching anything else.
Path analysis takes each user's first five post-signup events as an ordered tuple,
drops the universal signup_completed prefix, groups users by sequence, and ranks
by retention lift. Users with fewer than five events are excluded, which naturally
removes the Bouncers - they never accumulate a trajectory.
The decision that matters here is the denominator. Lift is computed against the candidate pool - users with ≥5 events, retaining at about 54% - not the full population's ~33%. The population base would roughly double every lift, but almost all of that increase would just be re-measuring "this user reached five events," which is the engagement signal the specificity filter already isolated one layer up. Two analyses double-counting the same effect would make both look stronger and neither more true.
Against the candidate pool, the top path is the pure Power trajectory:
onboarding_step_completed → workspace_created → onboarding_step_completed → onboarding_step_completed → onboarding_step_completed112 users · 81.2% retained · 1.50×
That is precisely the "Power user finishes all five onboarding steps in the first
day or two" pattern the generator encodes, recovered from event order alone.
Meanwhile the sequences that open with task_created or comment_posted before
onboarding is done sit at or below the base rate; the bottom of the top ten is
project_created-first at 0.99×. Jumping straight to the work isn't a
high-retention pattern. It's impatience, and now there's a number on it.
One implementation note that cost more time than it should have: Polars'
group_by on List columns is unreliable across minor versions. The workaround is
joining each sequence into a delimited string with the ASCII unit separator
(\x1f) as a stable hashable key, then recovering the list with first() in the
aggregation. Event names are letters and underscores, so the separator can never
collide. Ten minutes once you've seen it, an hour the first time.
Making the model stay grounded
The engine says what correlates. The last stage asks Claude Sonnet 4.6 to draft what you'd actually run: hypothesis, target segment, success event, guardrail metrics, expected effect size - a structured Pydantic object per spec.
The default failure mode here is plausibility theater: specs that read beautifully, cite invented event names, and predict effect sizes from nowhere. Three defenses, in increasing order of how much I learned from them.
Make the hallucination unrepresentable. success_event is declared in the
tool's JSON schema as a string enum over the 12 valid event names. The model
cannot return an invalid event - not "is discouraged from," cannot. Pydantic
re-validates on the way out as defense in depth. Where a constraint can be pushed
into the schema, that beats any amount of prompt instruction.
Discount the correlation explicitly. Left alone, the model quotes the observed lift as the expected experimental effect: a 3.20× lift becomes a promised 3.20× improvement. That's wrong, and wrong in the direction that gets an experiment funded. The observed gap includes pre-existing intent (motivated users seek out integrations unprompted) and selection (that cohort is 72% Power), neither of which an intervention can convert. The prompt says so directly - the realistic causal slice is 10–30% of the observed gap - and every spec now lands at +7 to +10pp against raw gaps of 47–54pp, roughly 14–20%, with the reasoning shown in the rationale field.
Then check that it actually did. A heuristic flags any spec whose predicted effect sits within ±5pp of the raw observed gap, which is the specific failure being defended against.
That third one is where it got interesting. On its first run it flagged all ten specs.
Every one of them was correct. Each led with a properly discounted 7–10pp prediction and then cited the raw 47–54pp gap as context for the discount - showing its work, exactly as asked. My detector was scanning the whole string, finding the cited raw figure, and treating it as the prediction. The fix was anchoring on the leading numeric value; one line of regex.
The bug was low-impact and I'd argue it was the most valuable thing in the synthesis stage, because a validator with a 100% false-positive rate is worse than no validator at all. No validator leaves you appropriately uncertain. One that cries wolf ten times out of ten teaches you to ignore it - and it keeps running, keeps shipping, keeps reporting, right up until the day it's correct. The arc of write a check, watch it flag everything, investigate, discover the check was wrong, fix the check is the part of evaluation work that never fits in a results table.
A representative spec, abbreviated:
Milestone:
integration_connected_within_7_days- 3.20× lift, 72.2% Power dominance.Hypothesis: If first-week users without an integration are shown a persistent sidebar card surfacing the four available integrations with one-click setup, plus a 48-hour email nudge, more will fire
integration_connectedwithin 7 days, raising week-4 retention.Success event:
integration_connected· Guardrails: week-4 churn among nudged users, support contact rate within 7 days, plan downgrade within 30 days.Expected effect: +7 to +10pp - roughly 15–20% of the +50.8pp correlation gap, accounting for self-selection in the observed cohort.
Rationale: "72.2% of the 'did' cohort are Power users with ~85% baseline retention, so a substantial portion of the gap reflects pre-existing intent rather than behavior-to-retention causation. A nudge can only convert the marginal user."
That last clause is the whole argument for the stage. A 3.20× lift looks like a 3.20× improvement waiting to be collected. It isn't - most of it is selection, and the honest number is the slice an intervention can plausibly move. Producing that number instead of the flattering one is the only reason to have a model in this pipeline at all.
Results
On 25,000 synthetic users and 370,489 events, all regenerated from seed while writing this:
- 24 actionable milestones from 44 candidate shapes (39 clear minimum sample;
15 cut by the specificity filter). Top:
completed_onboarding_step_5, 3.37× lift, 60.3% Power. - 25 distinct activation paths at min_sample=100. Top: the pure Power onboarding trajectory at 1.50× against the candidate-pool base.
- 10 experiment specs, each grounded in its milestone's real statistics with the causal discount applied.
- Persona validation passes cleanly: every top-5 milestone 57–73% Power, Bouncers 0.0%, Lookers ≤1.4%.
- Engine wall clock: 1.3 seconds for mining plus path analysis over 370k events. Synthesis adds ~200s for ten sequential model calls - the only slow part, and trivially parallel if it ever needs to be.
The dashboard is a single async Server Component fetching all three endpoints in parallel during SSR. No client components, no UI library, Tailwind only: a three-section read-only page doesn't justify the dependency surface of anything larger.
Limitations
- Synthetic data only. Real event streams have noise, late arrivals, schema drift, and identity-resolution problems no generator reproduces. Four personas is a useful caricature; real populations have many more latent types with blurrier edges. Every number here should be read with that attached.
- No real-time ingestion. Events are batch-loaded once. A production version needs stream ingestion, incremental cohort labelling, and a freshness guarantee. The engine is fast enough to run on a schedule; the work is all on the ingestion side.
- Blind to anti-patterns by design. It surfaces behaviors positively correlated with retention. Friction events, error patterns, and dead ends are equally interesting and completely invisible here. Negative-lift mining is about a page of code, and it isn't in scope.
- One fixed analysis window. Week-4 retention, hard-coded at days 21–28. Real analysis wants week 1, 4, and 12 side by side. The engine is parameterized; nothing exposes the parameter.
- Path analysis is shallow. Length-5 prefixes only - no variable prefix lengths, no unordered "any N of these within Y days" patterns. The combinatorial space is large and this is the simplest version that still produces something interpretable.
- No auth on the API, CORS pinned to localhost. Local demo surface.
- Redis is provisioned and unused. The natural cache seam is the miner's raw output, and caching a 1.3-second computation isn't justified at this throughput. Leaving it wired but unused is the honest state.
The meta-limitation: Wayline is a working demonstration of what a behavioral product intelligence engine looks like, not a deployed product. The version of this I'd put on a CV is built an activation-mining engine with a synthetic test bed, an evaluation methodology grounded in ground truth the engine cannot see, and an LLM stage whose output is grounded in real statistics rather than plausible-sounding invention - which is what the code backs, and no more.
Where everything lives
The engine, the generator and its 13-check verifier, the path analysis, the synthesis stage with its three grounding defenses, the FastAPI service, the dashboard, and an append-only decisions log recording every choice above with its reasoning are at github.com/egehazar/wayline.
Start with the specificity filter in api/engine/milestones.py. It's one
comparison - n_did / n_total <= max_share - and it's the line that turned a
correct answer into a useful one.